python程序设计 第三版 中文高清pdf版 (John Zelle) 下载
神经网络只是由两个或多个线性网络层叠加,并不能学到新的东西,简单地堆叠网络层,不经过非线性激活函数激活,学到的仍然是线性关系。
但是加入激活函数可以学到非线性的关系,就具有更强的能力去进行特征提取。
构造数据
import torch
import torch.nn.functional as F
from torch.autograd import Variable

import matplotlib.pyplot as plt

x = torch.linspace(-5, 5, 200)  # 构造一段连续的数据
x = Variable(x)	 # 转换成张量
x_np = x.data.numpy()	# 换成 numpy array, 出图时用
Relu
表达式:

代码:
y_relu = F.relu(x).data.numpy()
plt.plot(x_np, y_relu, c='red', label='relu')
plt.ylim((-1, 5))
plt.legend(loc='best')

plt.show()
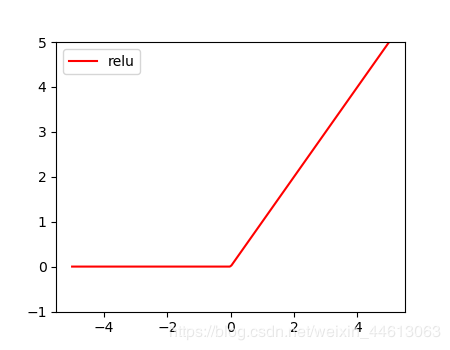
形状如图:
Sigmoid
表达式:

代码:
y_sigmoid = F.sigmoid(x).data.numpy()
plt.plot(x_np, y_sigmoid, c='red', label='sigmoid')
plt.ylim((-0.2, 1.2))
plt.legend(loc='best')

plt.show()
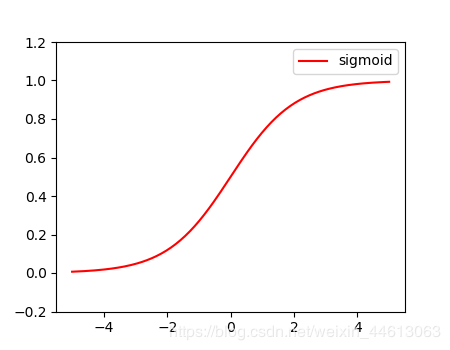
形状如图:
Tanh
表达式:

代码:
y_tanh = F.tanh(x).data.numpy()
plt.plot(x_np, y_tanh, c='red', label='tanh')
plt.ylim((-1.2, 1.2))
plt.legend(loc='best')

plt.show()
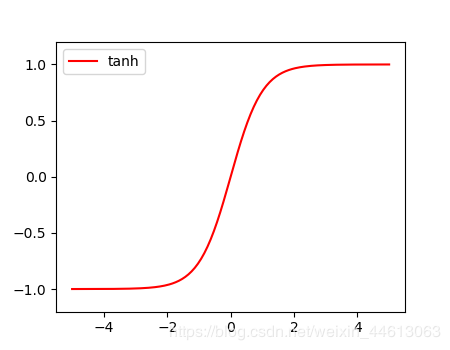
形状如图:
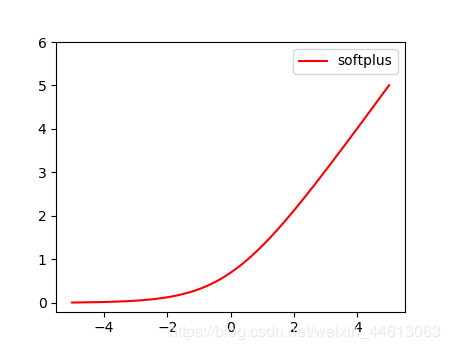
Softplus
表达式:

代码:
y_softplus = F.softplus(x).data.numpy()
plt.plot(x_np, y_softplus, c='red', label='softplus')
plt.ylim((-0.2, 6))
plt.legend(loc='best')

plt.show()
形状如图:
以上就是本文的全部内容,希望对大家的学习有所帮助,也希望大家多多支持谷谷点程序。
转载请注明:谷谷点程序 » PyTorch中常用的激活函数的方法示例
